Supply Chain
How much working capital is tied up in your inventory?
Inventory Dashboard
For trading and distribution companies with 500+ SKUs
The Inventory Dashboard by Den Otter Solutions is a production-ready Power BI template that gives SMEs full visibility into their inventory performance. The dashboard displays stock value, weeks of stock, GMROI, and reorder advice at SKU level — including supplier and category analysis. The template is ready to use with your own data or can be customised to specific data sources and KPI targets. All work is delivered fully remote.


1 / 5
KPIs & overviews
- Stock value and % deviation versus target
- Weeks of stock (based on last 13 weeks of sales)
- GMROI and target GMROI for margin efficiency
- Overview: out of stock, reorder needed, non-moving, discontinued
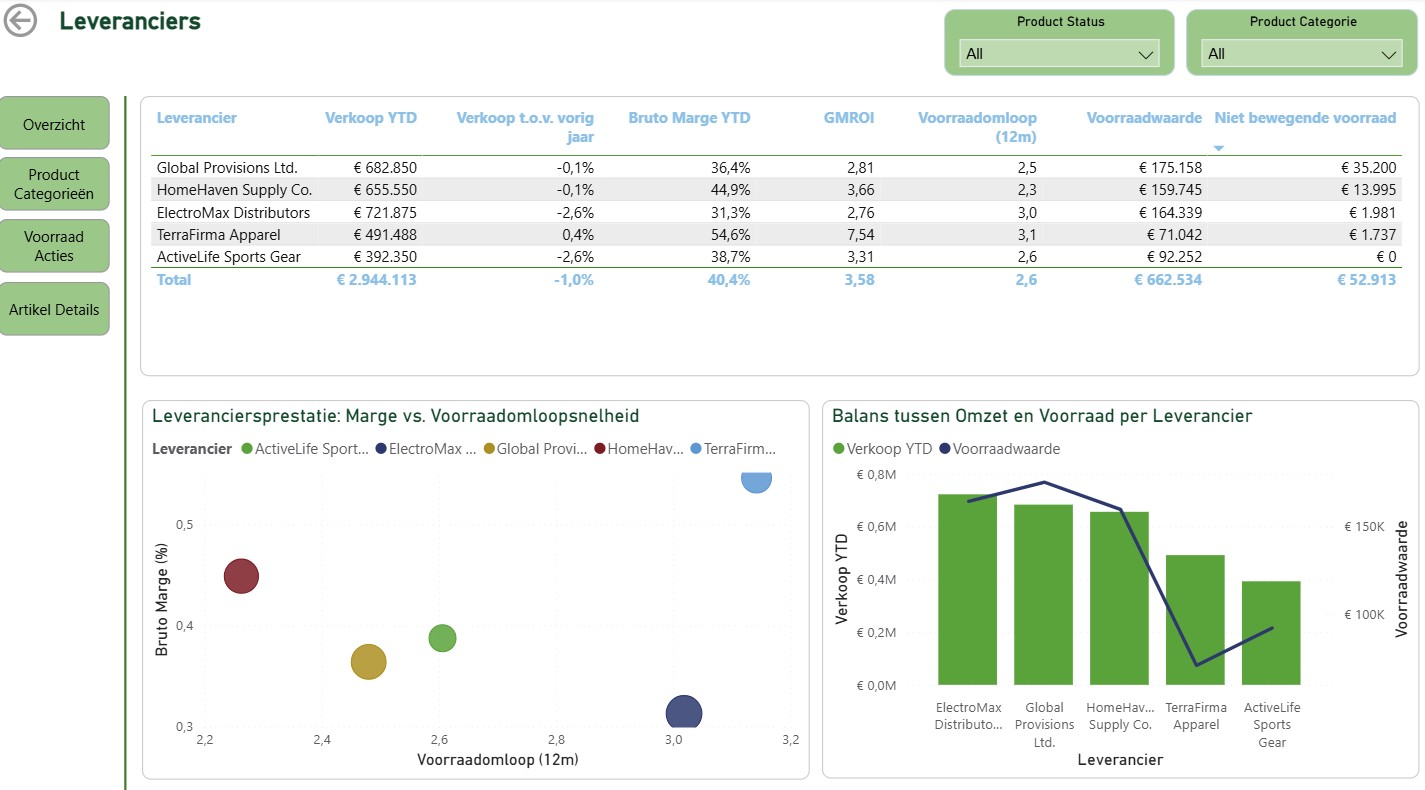
Analysis pages
- Product category analysis: sales, gross margin, GMROI, turnover, dead stock
- Supplier analysis: efficiency and margin contribution per supplier
- Scatter plot: gross margin vs. inventory turnover
- Treemaps for detailed categories
Actions & interventions
- Reorder advice: which products to replenish, including suggested quantity per SKU
- Dead and discontinued stock with quantity and value
- Drill-through from stock buckets to product detail
- Custom KPI targets configurable via dedicated KPI_Targets table
Finance
How healthy are your finances — really?
Financial Dashboard
For online retailers, DTC brands, and marketplace sellers
The Financial Dashboard by Den Otter Solutions is a production-ready Power BI template that gives online retailers and DTC brands full visibility into revenue, profitability, cash flow, and working capital. The dashboard includes an 8-week cash flow forecast, profit and loss analysis versus budget, balance sheet and liquidity monitoring, and channel comparison — all in one interactive dashboard with automatic date comparisons and colour-coded alerts. Delivered fully remote, wherever you operate.


1 / 4
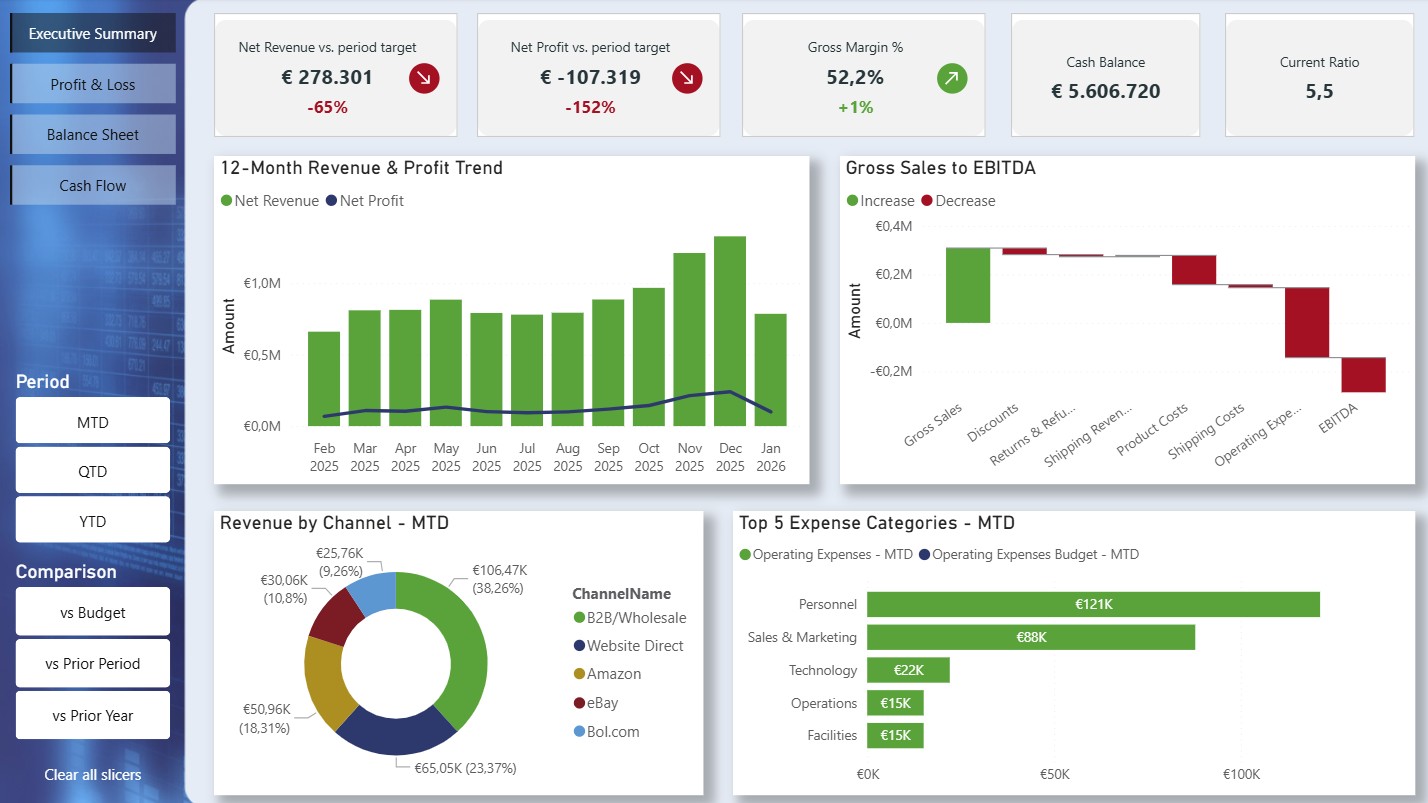
Summary & KPIs
- Net revenue vs. period target with variance tracking
- Net profit vs. budget and profitability monitoring
- Gross margin percentage, cash balance, and current ratio
- 12-month revenue and profit trend + waterfall chart gross revenue → EBITDA
- Revenue by channel (Amazon, website, eBay, B2B) and top-5 costs vs. budget
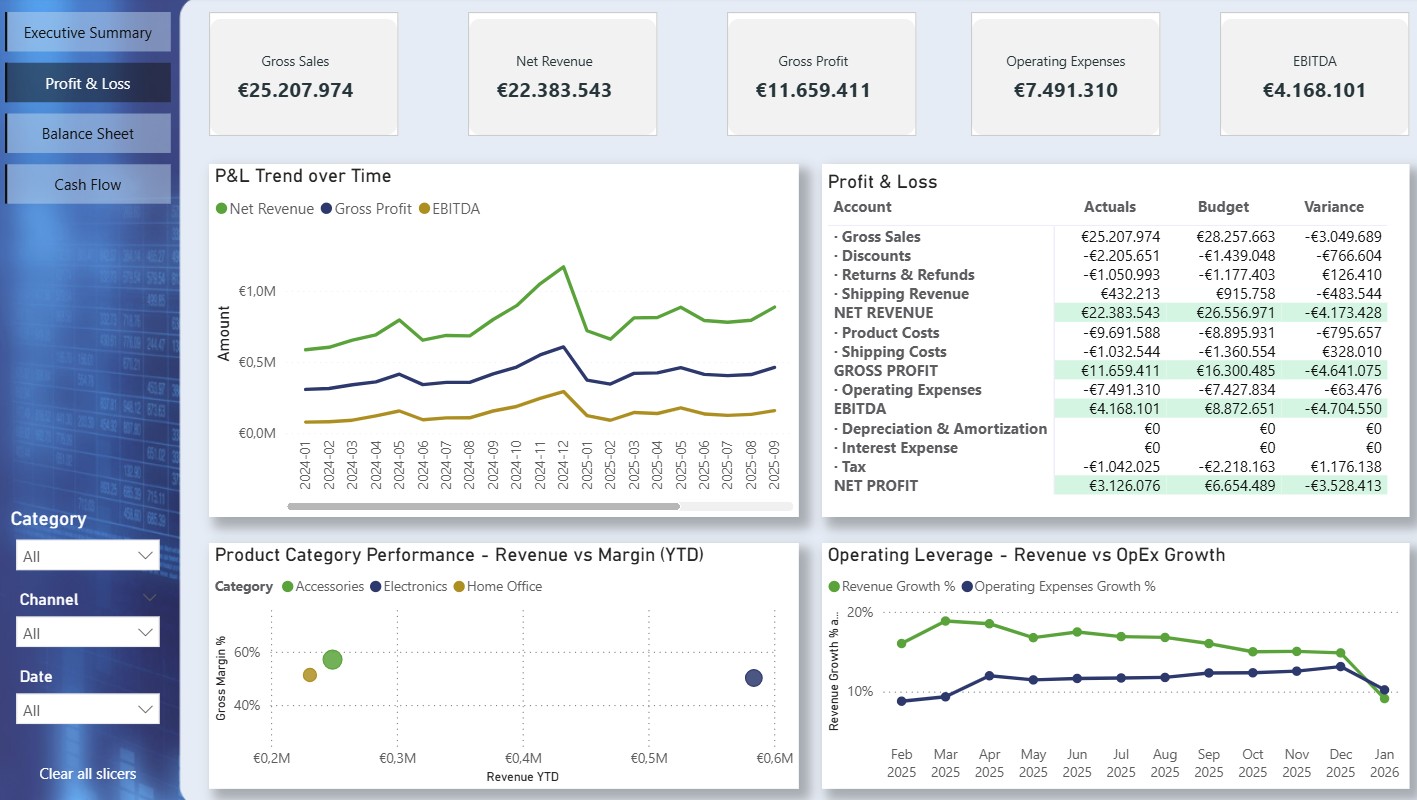
Analysis pages
- Profit & loss statement: actual vs. budget for all line items
- Product category scatter plot: revenue vs. margin + operational leverage
- Balance sheet & liquidity: working capital, current ratio, quick ratio, asset composition
- Cash flow: 8-week forecast, cash conversion cycle, AP ageing by bucket
Additional functionality
- MTD, QTD, and YTD period selection with automatic comparison
- Budget variance with colour-coded alerts
- Prior year and prior period comparisons
- Date-dependent reporting + forecast integration for cash planning
Marketing
Which marketing channels actually deliver?
Marketing Dashboard
For marketing teams managing multiple advertising platforms
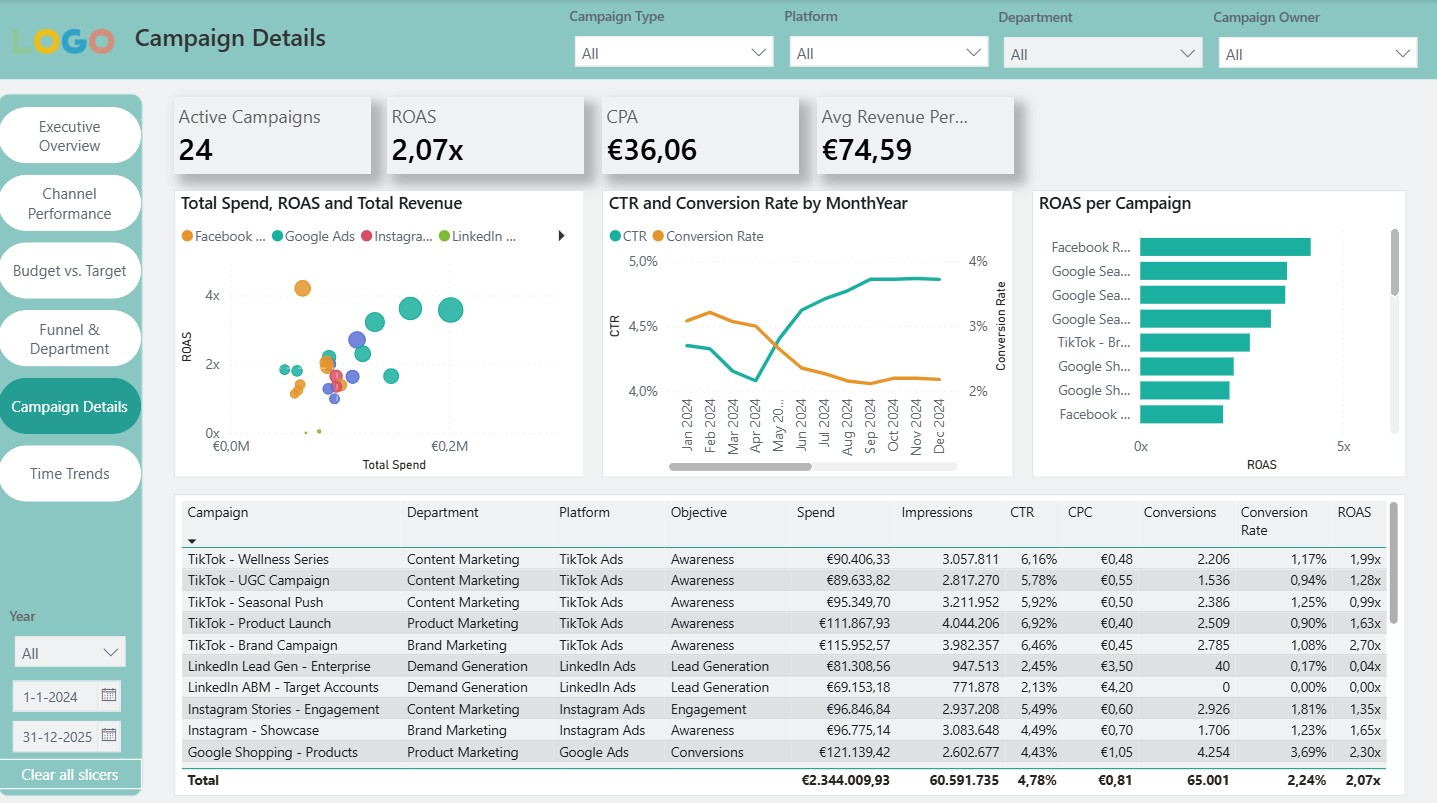
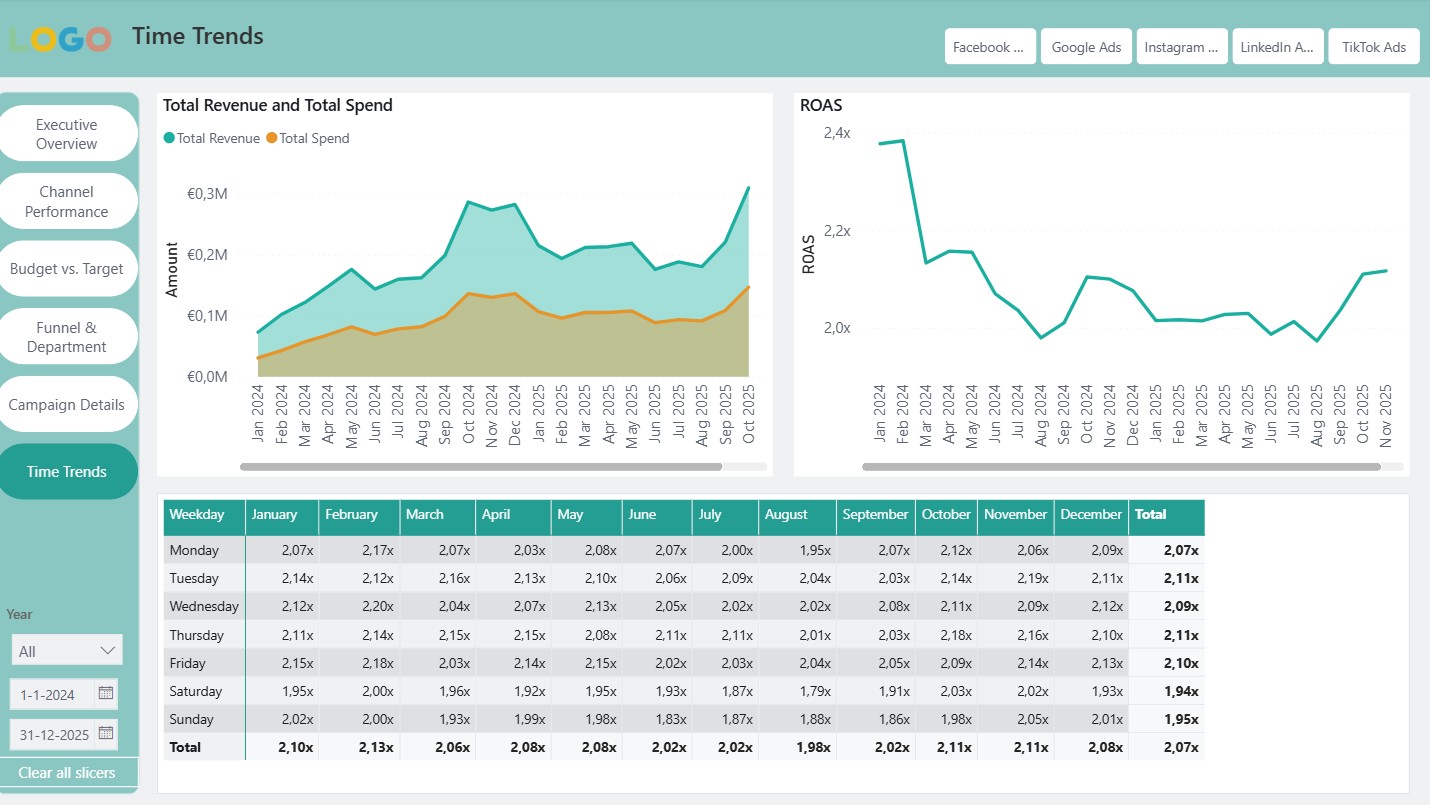
The Marketing Dashboard by Den Otter Solutions is a production-ready Power BI template with 69 pre-built DAX measures for ROAS, CPA, budget tracking, and target variance. The dashboard brings data from Google Ads, Facebook, Instagram, LinkedIn, and TikTok together across six interactive pages — from executive overview and channel performance to campaign detail and seasonal analysis. Includes an Excel data template with sample data and a 12-chapter user guide. Delivered fully remote, wherever you operate.


1 / 6
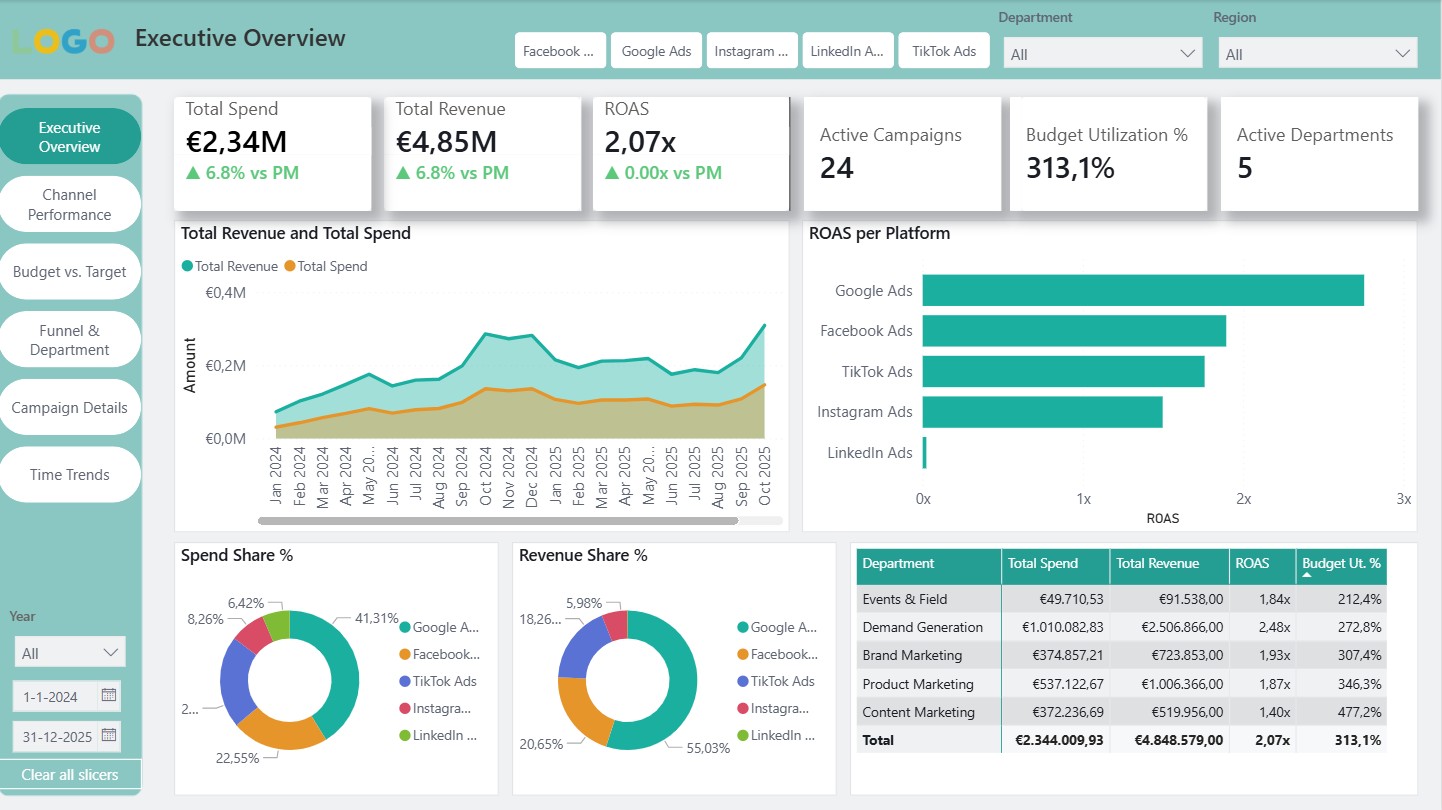
6 dashboard pages
- Executive overview: KPI cards with MoM trends, spend vs. revenue, ROAS by platform
- Channel performance: CPC vs. CPA, CTR vs. conversion rate quadrant, ROAS trend
- Budget vs. target: variance analysis, burn-down, projected end-of-month, budget usage
- Funnel & department: ROAS by funnel stage, regional breakdown, campaign leaderboard
- Campaign detail: efficiency quadrants (stars, hidden gems, money pits)
- Time trends: heatmaps, seasonal analysis, YTD tracking, budget burn
69 DAX measures in 8 categories
- Core metrics, KPIs, time intelligence, budget, targets, cross-channel
- Pro-rata budget calculations that automatically adjust to any date range
- Target variance: spend, revenue, ROAS, and conversions vs. target
- Traffic light colours (green/amber/red) for ROAS, CPA, budget, and profit
Works with
- Google Ads · Facebook Ads · Instagram Ads · LinkedIn Ads · TikTok Ads
- Manual export + API options (platform connection guide included)
- Includes Excel data template with sample data and user guide
Also for agencies
Managing marketing for multiple clients? An Agency version is also available that lets you monitor multiple client accounts from a single dashboard — with client-specific filtering, benchmarking, and reporting.